")


Employment and unemployment in the Prnjavor Municipality
- Since 2015, the number of the unemployed constantly decreases, while the number of employees increases.
- Number of the unemployed in the Prnjavor Municipality continued to decrease – in 2023, there was 49,12% less the unemployed than in 2019.
- Number of employees increased in the period 2019-2023 – in 2023, there is 9% employees more than in 2019.
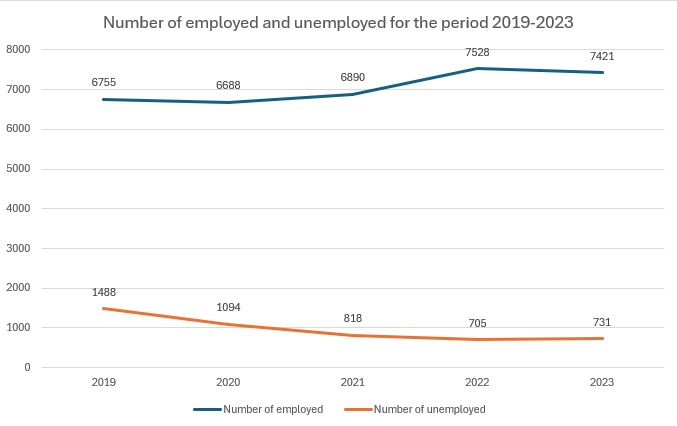
Source: Institute for Statistics of the RS
In the territory of the Prnjavor Municipality, the number of employees as of 31 December 2023 amounted to 7421.
Table 1- Average number of employees in the territory of the Prnjavor Municipality
|
Average number of employees |
|||||
|
Year |
2019. |
2020. |
2021. |
2022. |
2023. |
|
Prnjavor |
6755 |
6688 |
6890 |
7528 |
7421 |
|
Total in the RS |
272.366 |
274.227 |
279.030 |
286.679 |
290.491 |
Source: Institute for Statistics of the RS
ACTIVE SUPPLY OF WORKFORCE IN THE TERRITORY OF THE PRNJAVOR MUNICIPALITY
|
ACTIVE SUPPLY OF WORKFORCE |
|||||
|
Qualification |
Total |
Women |
Age group |
Total |
Women |
|
No education |
21 |
8 |
Od 15 - 18 |
0 |
0 |
|
Unskilled workers |
95 |
44 |
Od 18 - 20 |
14 |
8 |
|
Semi-skilled workers |
77 |
32 |
Od 20 - 24 |
68 |
40 |
|
Skilled workers |
241 |
89 |
Od 24 - 27 |
58 |
32 |
|
Secondary school education - technicians |
209 |
122 |
Od 27 - 30 |
39 |
20 |
|
Highly-skilled specialists |
0 |
0 |
Od 30 - 35 |
48 |
28 |
|
College |
9 |
6 |
Od 35 - 40 |
42 |
29 |
|
University degree, 180 ECTS |
11 |
8 |
Od 40 - 45 |
74 |
42 |
|
University degree, 240 ECTS, 4/5/6 years |
63 |
36 |
Od 45 - 50 |
81 |
35 |
|
Master 300 ECTS |
4 |
3 |
Od 50 - 55 |
60 |
23 |
|
Master’s Degree, old programme |
0 |
0 |
Od 55 - 60 |
103 |
37 |
|
Doctors of science |
0 |
0 |
Od 60 - 65 |
70 |
24 |
|
65 |
3 |
0 |
|||
|
T O T A L |
731 |
318 |
T O T A L |
731 |
318 |
Source of data: Employment Service of the Republika Srpska